FleekDash 1.2.1 pairs performance optimization with visibility: when you enable monitoring, a Performance Monitor widget appears on the site so you can see memory pressure, problematic components, and an average score without digging through logs alone. Behind the scenes, caching and processing improvements keep the dashboard responsive as your library grows.
What's New
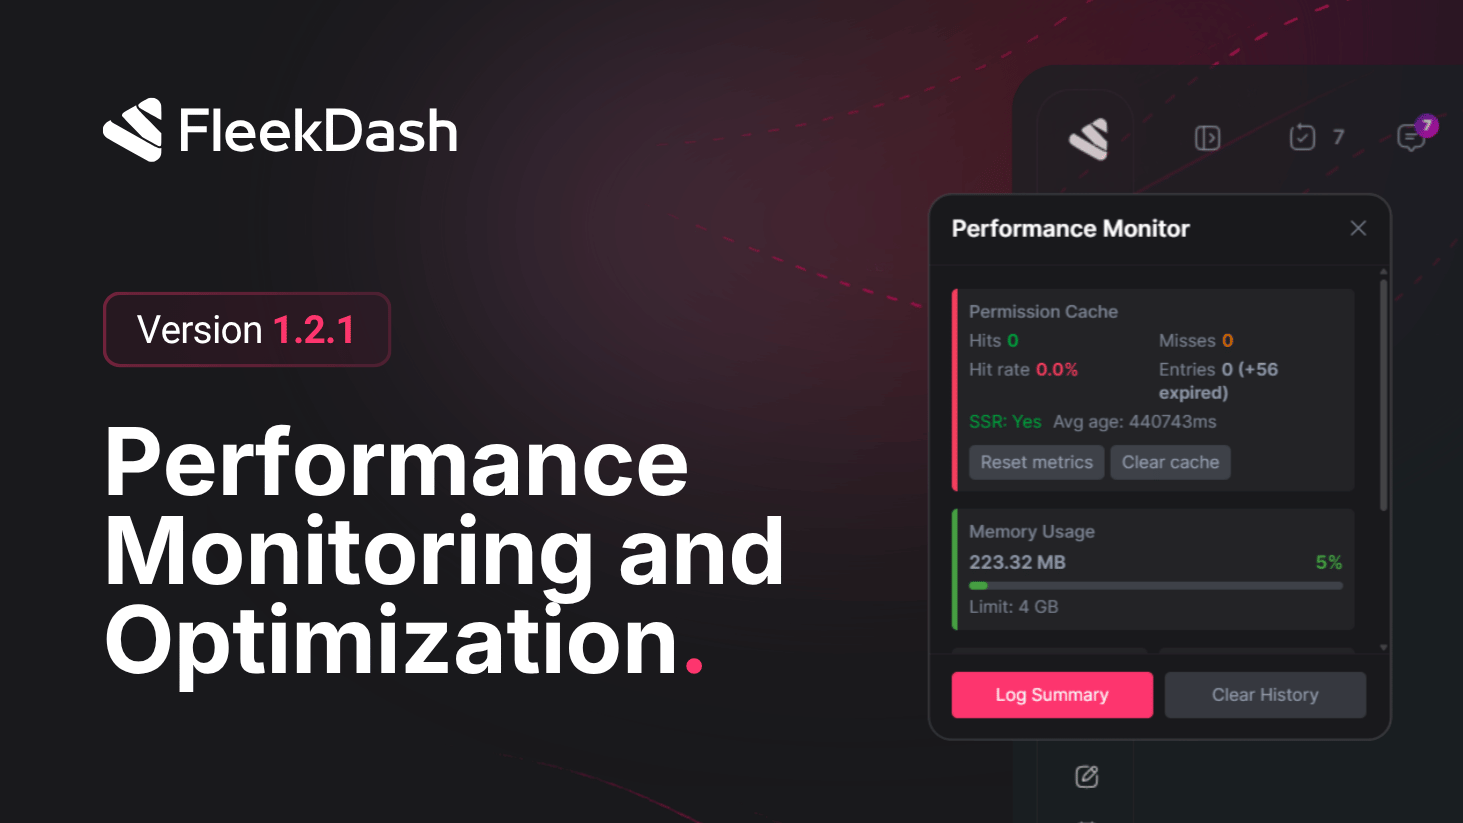
Performance Monitor: turn monitoring on to surface an on-site widget that summarizes how things are running where it matters.
Memory Usage: live memory insight directly in the widget so you can spot spikes early.
Components With Issues: surfaces components that need attention so fixes are easier to prioritize.
Average Performance Score: a single headline score to track overall health in the title bar.
What's Improved
Dedicated image cache with a 24-hour window, cutting redundant work on repeat loads.
Two-tier caching: fast in-memory layer plus persistent storage for speed and reliability together.
Intelligent cache refresh when posts or images change, so editors always see current assets.
Lean content scanning for very large posts (first 10,000 characters analyzed) and progressive image checks ordered by cost, with detection results cached after the first view for near-instant follow-up renders.
Lower server load from fewer repeated expensive operations.