FleekDash 2.4.6 introduces a central error experience: crashes no longer leave you with a broken or silent UI. You get clear messaging, optional technical depth, and Send Report so support receives structured context without hunting log files.
What's New
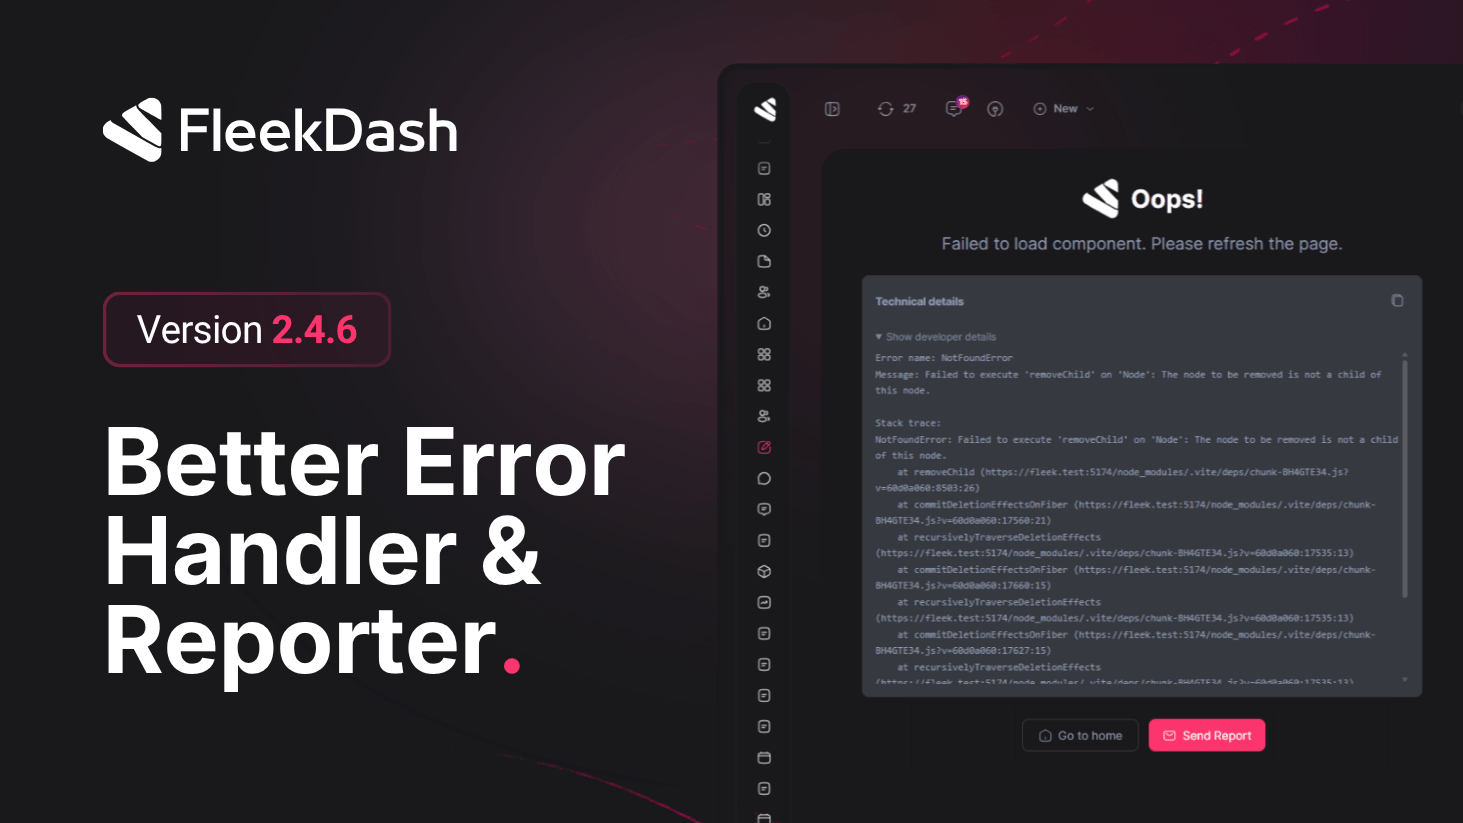
Unified error screen wherever FleekDash catches a failure (navigation, route loads, view crashes): human-readable title and message; WordPress API messages are normalized so HTML does not appear as visible text.
Try again retries the failed route when the router allows it; otherwise performs a safe reload for the app.
Show developer details expands error type, message, and stack trace; Copy puts the technical block on the clipboard for tickets or Slack.
Send Report collects safe diagnostics (error name, normalized message, stack when available, page URL, user agent), posts to FleekDash’s error-report REST endpoint over HTTPS, and delivers mail to support@fleekdash.com via WordPress (wp_mail) with site context when available. On success you get on-screen confirmation; if mail fails, a toast explains the issue and a text summary may be copied as fallback.
Production debugging hooks for advanced troubleshooting: open with ?debug=1 or localStorage.setItem("fleekdash_debug", "true") (reload), exposing window.debugReact helpers for exports and error-report workflows, separate from categorized helpers (debugLog, debugWarn, debugError), which do not send reports by themselves.
What's Improved
Clear separation of concerns: Send Report handles one-shot incidents to support; Debug Settings (#/settings/debug) remains the place for broader logging policy. See Debug & Performance Tools in docs.
Privacy-aware reporting: payloads are for diagnosis, not passwords or arbitrary form contents; delivery depends on host email configuration (SMTP, etc.).