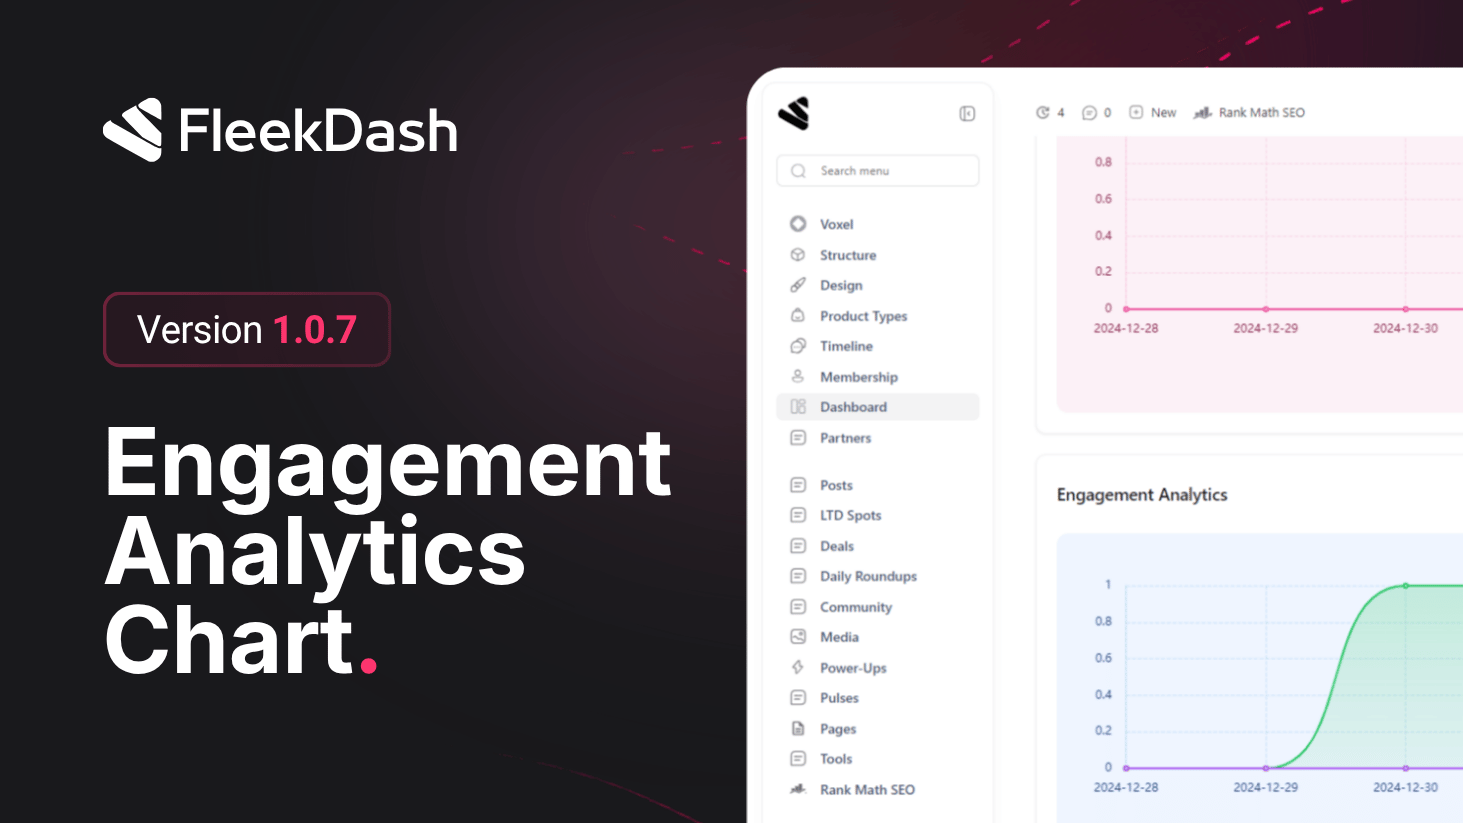
Get a clearer picture of how your audience interacts with your site.
The new Engagement Analytics chart lets you compare comment activity and other engagement metrics side by side, including deep data from third-party plugins. It is an early analytics tile on that roadmap, v2.x refines dashboard-wide charts, refresh, and cache behavior around similar surfaces.
What's New
Engagement Analytics chart: a new chart to track and compare engagement across your site, with support for comments and other key metrics visualized side by side.
Voxel engagement metrics: when Voxel is installed, FleekDash automatically pulls in Voxel-specific metrics including Status Likes, Timeline Replies, and Reply Likes.
What's Fixed
Charts post type selector now correctly filters data as expected.
Various visual improvements and consistency fixes across FleekDash Charts.
Why it matters
Comments and engagement are usually the first signal that a site's community is healthy or dying, but WordPress gives you no chart for them -- you either count rows or install a separate analytics plugin. Pulling this into the dashboard means agencies can show clients a real engagement trend in a monthly call instead of a screenshot of a comments list, and Voxel sites get their extra activity data in the same view.